.avif)
LITHOS
The Breathwork Device
The Design Thesis
With so many apps competing for our attention, Lithos was designed as an "anti-device." The main challenge was to make a digital companion for the Haptic Stone that wouldn't keep users glued to their screens.
The solution uses a "Dark-State" protocol. After setup, the screen turns off when the session begins. The user then feels only the stone’s vibration, which shifts their focus from looking at the screen to feeling the device.
The solution uses a "Dark-State" protocol. After setup, the screen turns off when the session begins. The user then feels only the stone’s vibration, which shifts their focus from looking at the screen to feeling the device.
%20(1).avif)
The Scientific Context
The way users interact with Lithos is based on how the vagus nerve works. Controlled breathing can help move the nervous system from a state of fight-or-flight to rest-and-digest.
Most breathwork apps use strict timers, which can make people feel anxious about their performance. Lithos removes the clock and instead tries to show what breathing feels like, not just track numbers.
Most breathwork apps use strict timers, which can make people feel anxious about their performance. Lithos removes the clock and instead tries to show what breathing feels like, not just track numbers.
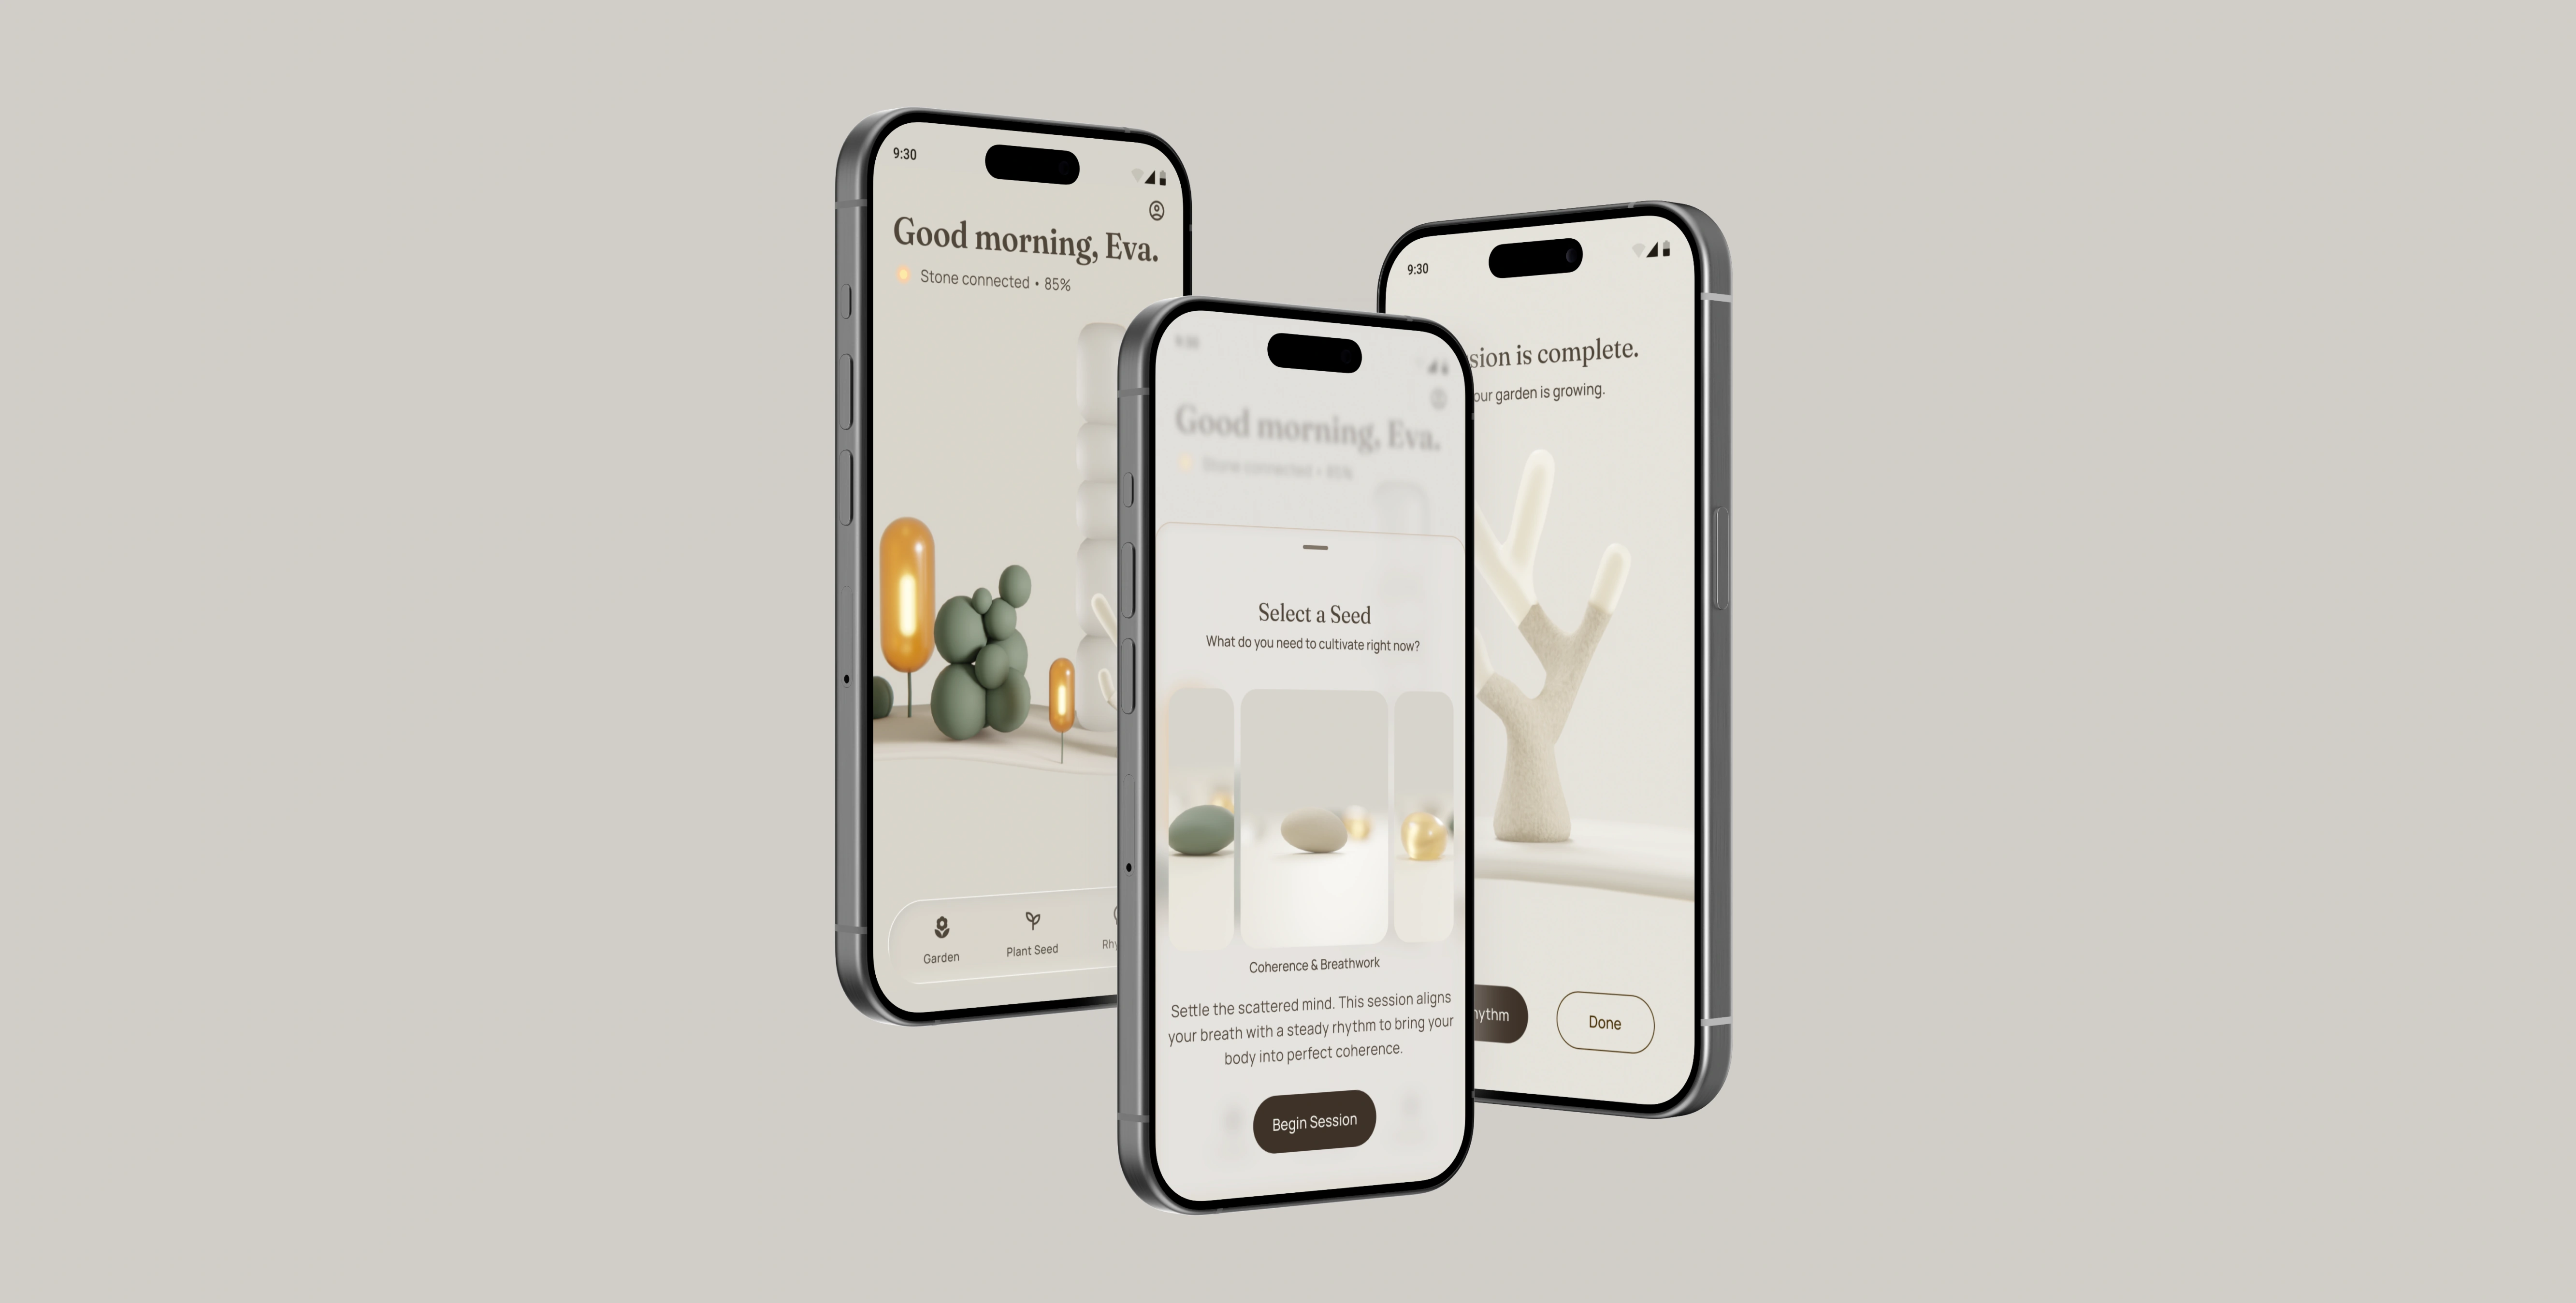
The Digital Garden
Instead of a typical dashboard, the main hub is designed as a growing digital garden.
I created the trees as abstract, soft shapes rather than realistic plants. This abstract style encourages users to interpret them in their own way and matches the tactile feeling of the hardware.
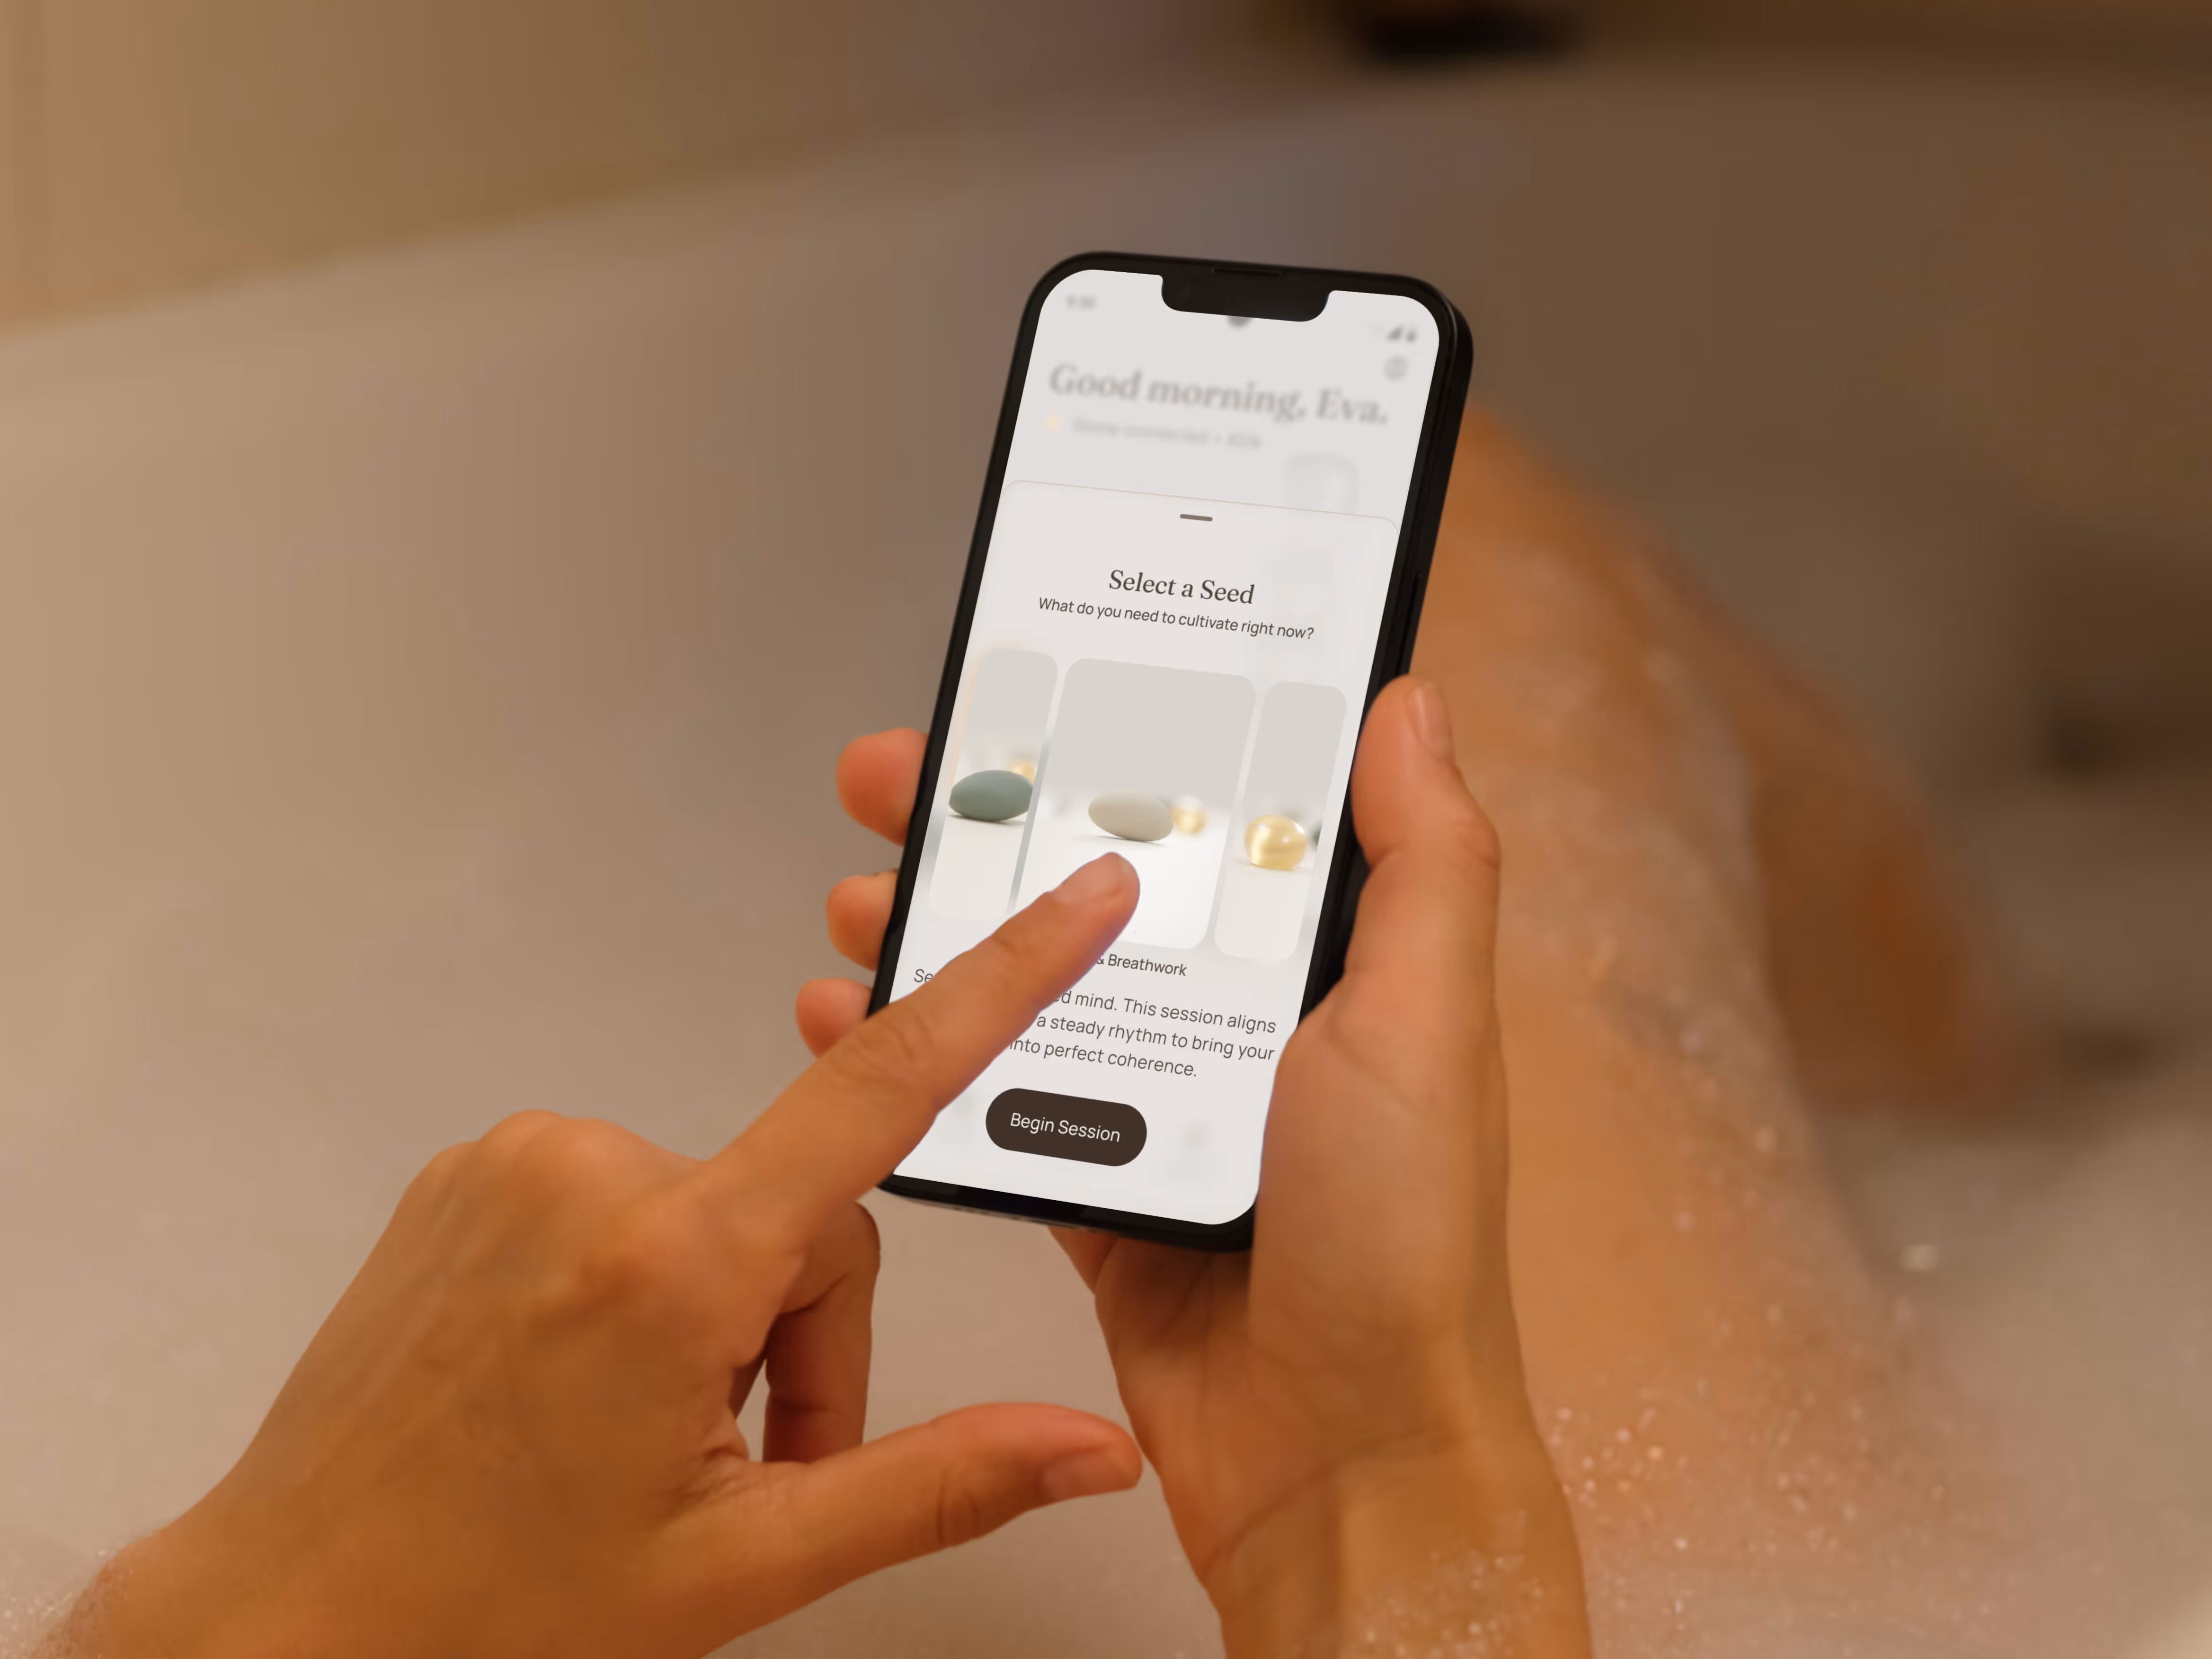
I designed four different "Seeds" to visually represent different breathing techniques:
- Sand Seed (Coherence): Uses a 1:1 resonant frequency (6 breaths/min) to synchronise heart rate variability (HRV).
- Glass Seed (Focus): Uses Box Breathing (4-4-4-4). A rigid structure designed to heighten cognitive alertness.
- Green Seed (Balance): Uses an Extended Exhale (1:2 ratio). Stimulates the Vagus nerve to immediately lower cortisol.
- Amber Seed (Sleep): Uses the 4-7-8 Technique. A rhythmic tranquilliser that forces a parasympathetic shift for rest.
I created the trees as abstract, soft shapes rather than realistic plants. This abstract style encourages users to interpret them in their own way and matches the tactile feeling of the hardware.
I designed four different "Seeds" to visually represent different breathing techniques:
- Sand Seed (Coherence): Uses a 1:1 resonant frequency (6 breaths/min) to synchronise heart rate variability (HRV).
- Glass Seed (Focus): Uses Box Breathing (4-4-4-4). A rigid structure designed to heighten cognitive alertness.
- Green Seed (Balance): Uses an Extended Exhale (1:2 ratio). Stimulates the Vagus nerve to immediately lower cortisol.
- Amber Seed (Sleep): Uses the 4-7-8 Technique. A rhythmic tranquilliser that forces a parasympathetic shift for rest.
%20(5).avif)
.avif)
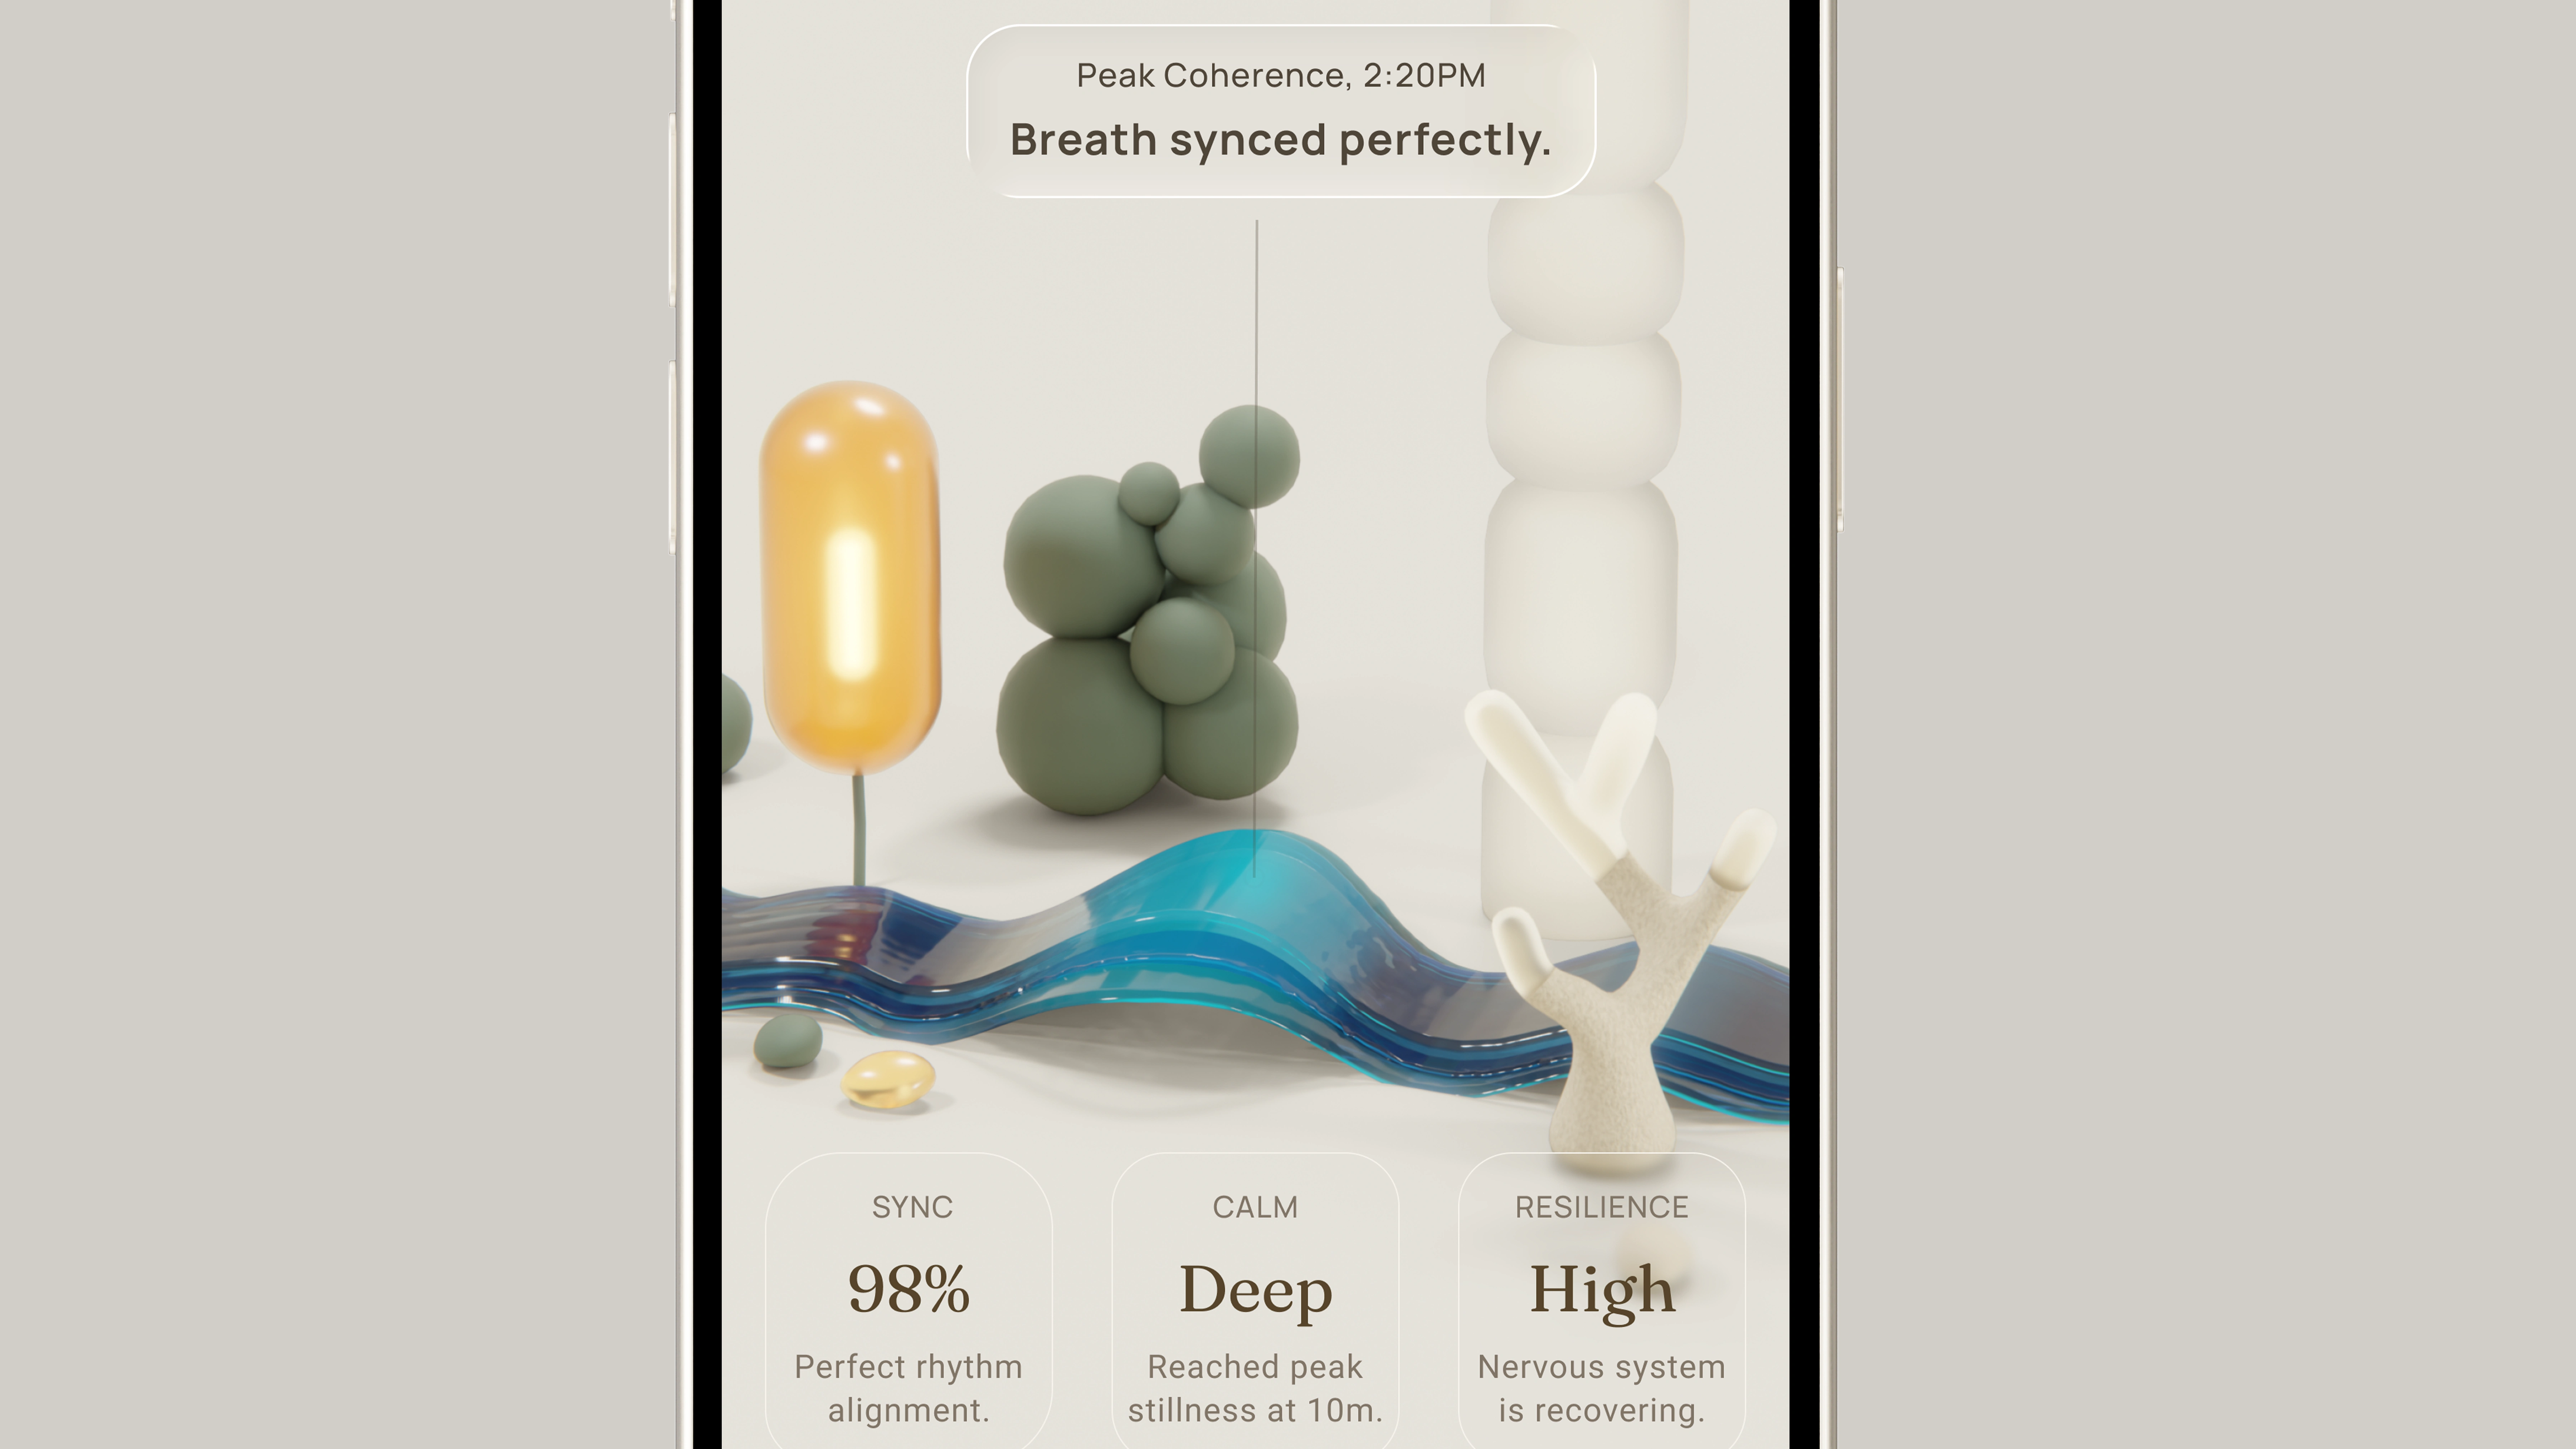
Data Visualization: The River
When the session ends, the app does not give simple scores like "85 out of 100". Instead, it shows the quality of the session as a topographical river system, helping users see and appreciate their experience as a whole.
This screen turns raw biometric data, like heart rate variability and breath duration, into a visual landscape:
Wave Height (Amplitude): Represents the depth of the breath. A deep, diaphragmatic breath creates a majestic, tall crest.
Wave Frequency (Rhythm): Represents the speed of the wave. A coherent state creates long, rolling swells; anxiety creates choppy ripples.
River Width: Shows session duration. As the session lengthens, the river widens, representing the time invested.
Users can see the shape of their nervous system. A jagged river means stress, while a smooth river means calm and flow. This feedback encourages users to stay calm and create a more beautiful graph.
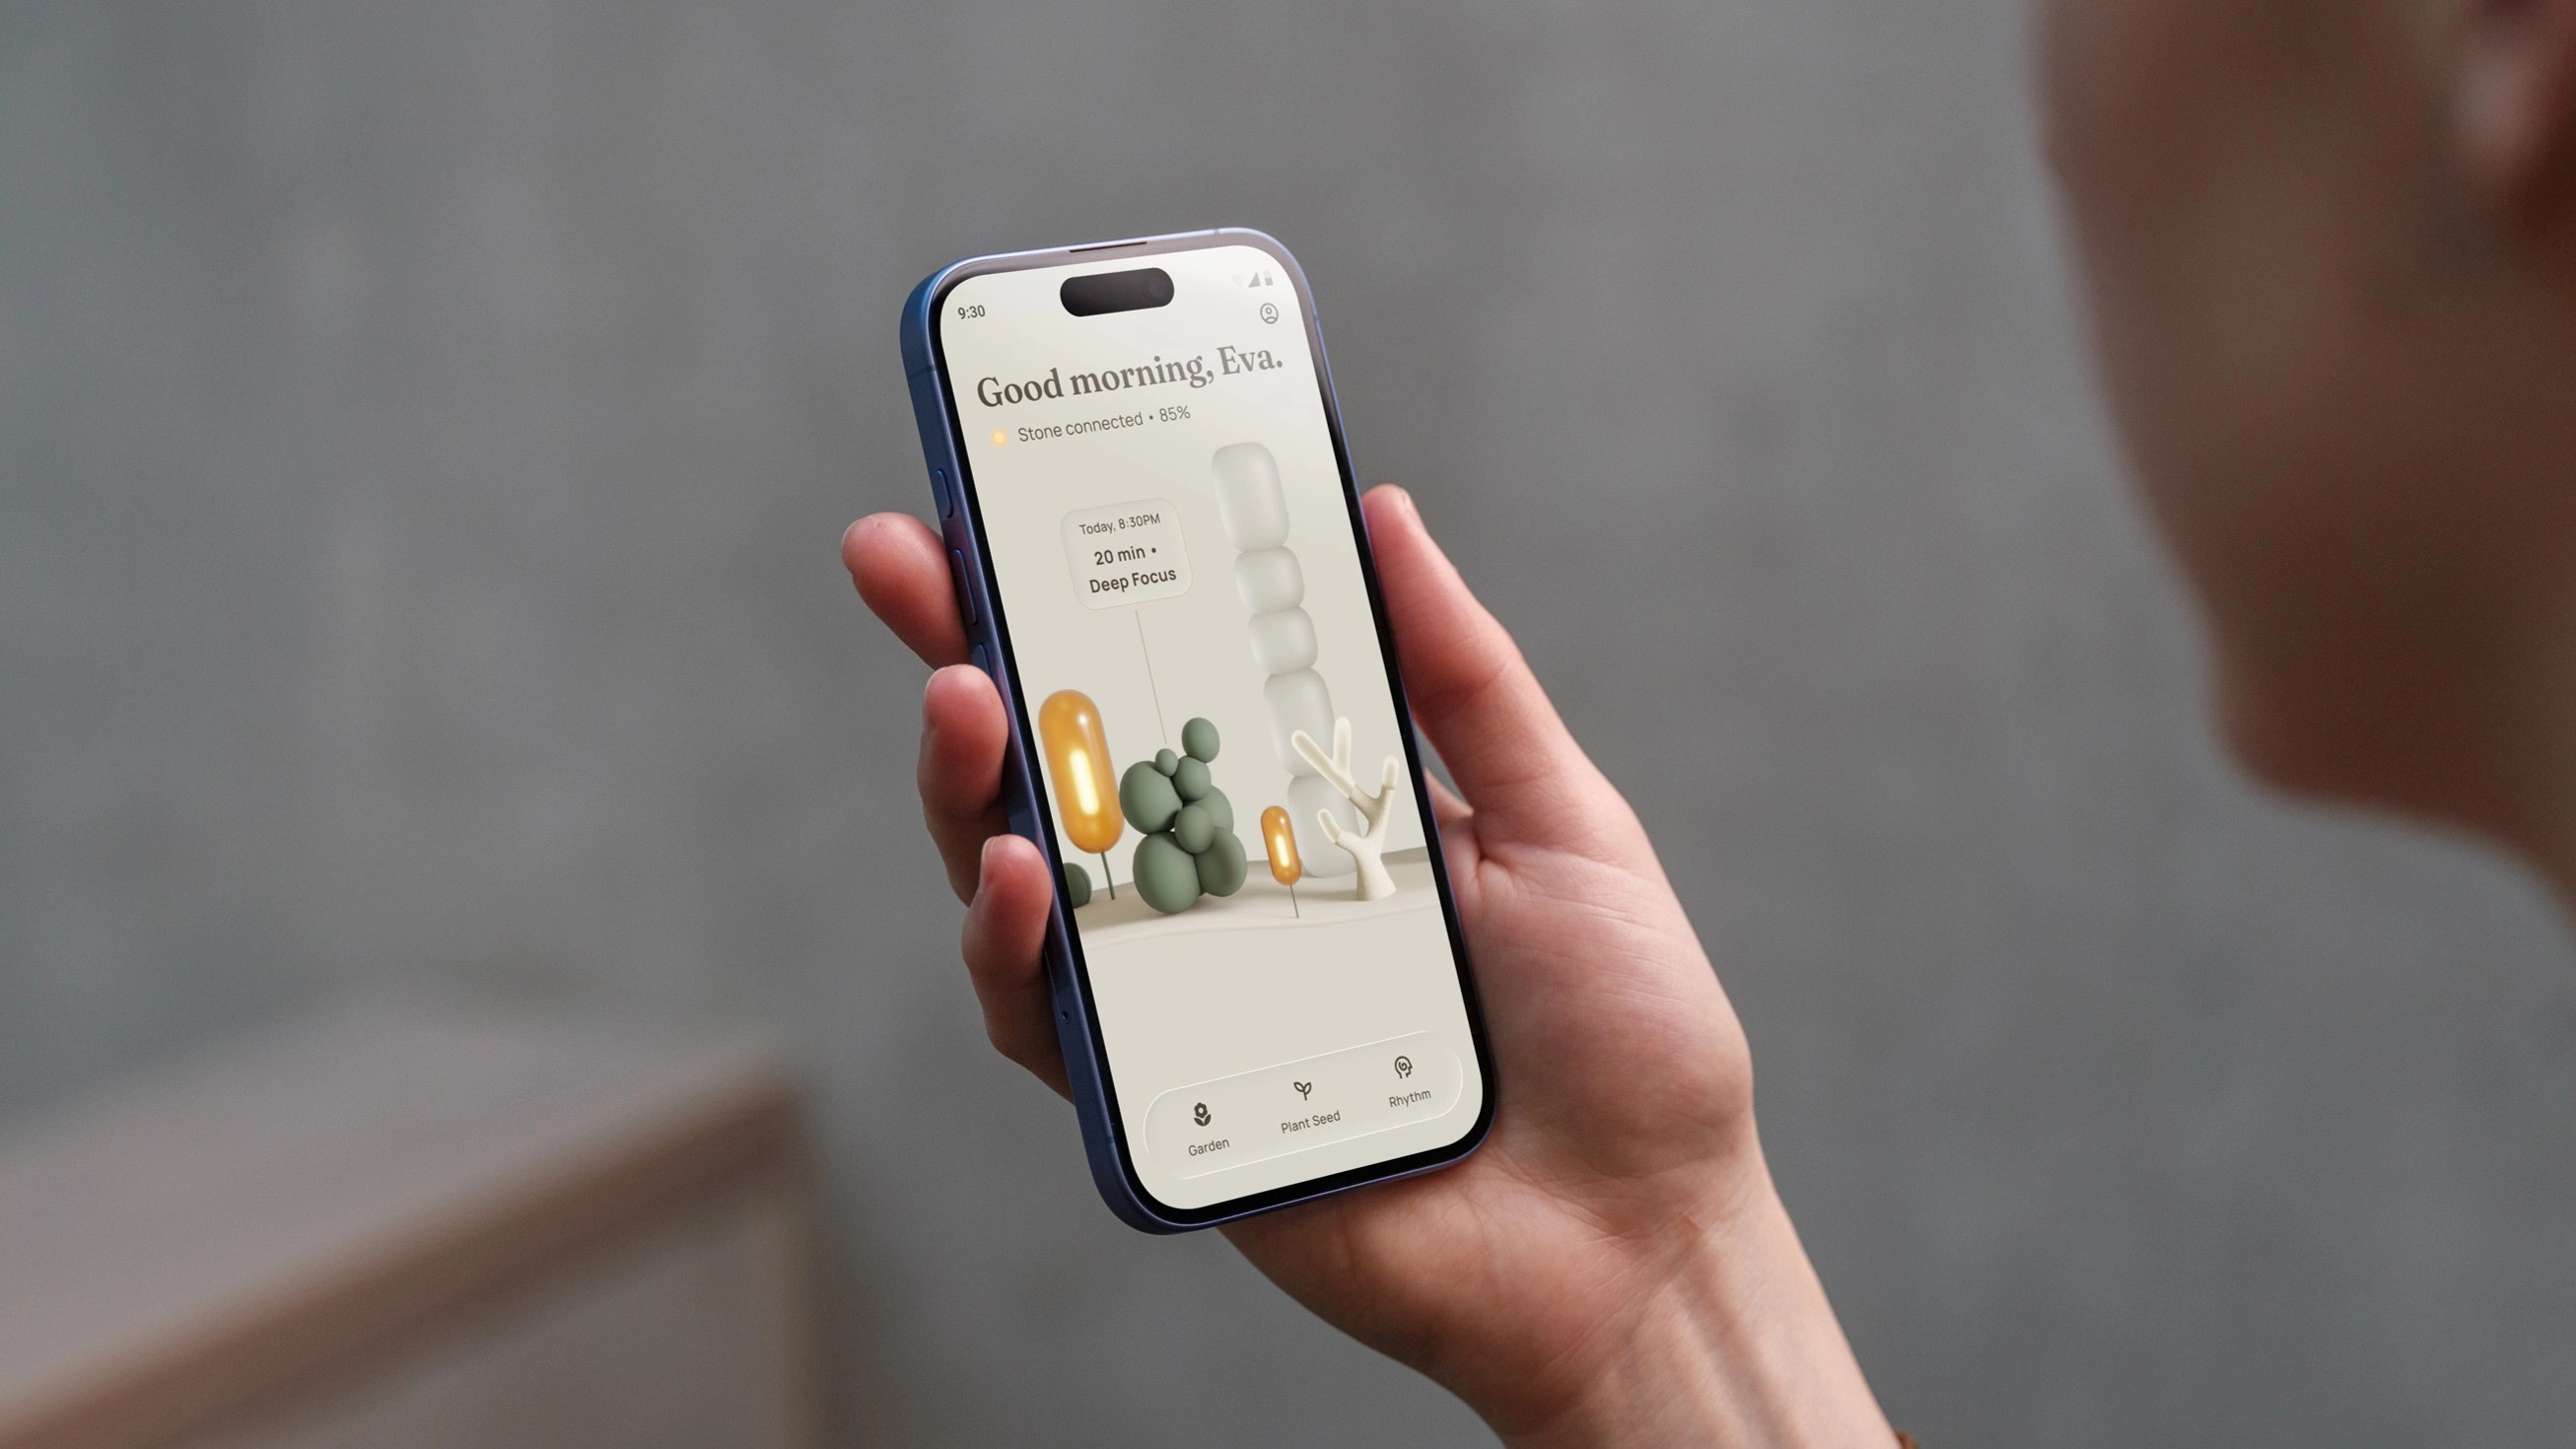
Chronology & Growth
Instead of showing history as a list, the app presents it as a landscape. Users can scroll horizontally to revisit past sessions, which highlights a sense of continuity.
Each session adds a new tree to the Garden. Short sessions grow small saplings, while longer sessions create mature trees. Over time, the user's screen fills with a peaceful, dense forest.
Each session adds a new tree to the Garden. Short sessions grow small saplings, while longer sessions create mature trees. Over time, the user's screen fills with a peaceful, dense forest.
A Circadian Interface
The interface is designed to make the screen feel like a real, liveable space.
The UI uses glassmorphism to create a frosted glass effect above the garden, which separates the utility area from the world layer.
A dynamic lighting model follows the local time. The "digital sun" creates warm shadows in the morning, while moonlight appears at night, making the interface feel connected to real time.
Conclusion
Lithos is a key project in my portfolio because it brought together all of my skills. I took ownership of translating complex biometric data and scientific research into a product that feels both intuitive and emotionally meaningful.
This project shows what modern product design can be at its best. By uniting hardware, software, and visual direction, I delivered a unified experience that puts users—not screens—at the heart of the product.
This project shows what modern product design can be at its best. By uniting hardware, software, and visual direction, I delivered a unified experience that puts users—not screens—at the heart of the product.